
Page 20 - OIT Progress Report: 2023 Edition
P. 20
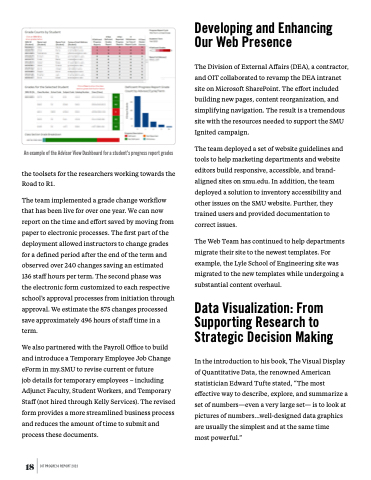
 An example of the Advisor View Dashboard for a student’s progress report grades
the toolsets for the researchers working towards the Road to R1.
The team implemented a grade change workflow that has been live for over one year. We can now report on the time and effort saved by moving from paper to electronic processes. The first part of the deployment allowed instructors to change grades for a defined period after the end of the term and observed over 240 changes saving an estimated 136 staff hours per term. The second phase was
the electronic form customized to each respective school’s approval processes from initiation through approval. We estimate the 875 changes processed save approximately 496 hours of staff time in a term.
We also partnered with the Payroll Office to build and introduce a Temporary Employee Job Change eForm in my.SMU to revise current or future
job details for temporary employees – including Adjunct Faculty, Student Workers, and Temporary Staff (not hired through Kelly Services). The revised form provides a more streamlined business process and reduces the amount of time to submit and process these documents.
Developing and Enhancing Our Web Presence
The Division of External Affairs (DEA), a contractor, and OIT collaborated to revamp the DEA intranet site on Microsoft SharePoint. The effort included building new pages, content reorganization, and simplifying navigation. The result is a tremendous site with the resources needed to support the SMU Ignited campaign.
The team deployed a set of website guidelines and tools to help marketing departments and website editors build responsive, accessible, and brand- aligned sites on smu.edu. In addition, the team deployed a solution to inventory accessibility and other issues on the SMU website. Further, they trained users and provided documentation to correct issues.
The Web Team has continued to help departments migrate their site to the newest templates. For example, the Lyle School of Engineering site was migrated to the new templates while undergoing a substantial content overhaul.
Data Visualization: From Supporting Research to Strategic Decision Making
In the introduction to his book, The Visual Display of Quantitative Data, the renowned American statistician Edward Tufte stated, “The most effective way to describe, explore, and summarize a set of numbers—even a very large set— is to look at pictures of numbers...well-designed data graphics are usually the simplest and at the same time
most powerful.”
 18 OIT PROGRESS REPORT 2023
